Making Julia Better
Author: Sina G. Lewis
Profiling
Profiling allows you to identify where your code would most benefit from optimization. The profilers discussed below identify how much time your code spends on a call to particular function and it’s sub-calls. Profiling also allows you to identify where your program is allocating more memory.
VS Code
VS Code has a built-in profiling package that is called by using @profview. This function provides the easiest most straightforward method of seeing where your code would most benefit from optimization. If you want to see how your code performs without the initial compilation that Julia uses, you will likely need to execute your code twice. For example, if we want to analyze the function my_func we would call
 # the results from this call might contain Julia compilation information
@profview my_func()

 # the results from this call should show only runtime information about the function
@profview my_func()
If you are not using VS Code, or want functionality that this built-in function doesn’t provide, check out the Julia packages below.
After identifying the portion of your code that could most benefit from optimization, you can use Benchmarking.jl to test different implementations.
Julia
Julia provides a profiling package, straightforwardly called Profiler.jl. The output that comes with the standard library is purely text-based. If you want to generate flamegraphs as a visual way to profile the code, like the one below, we need to import more packages.
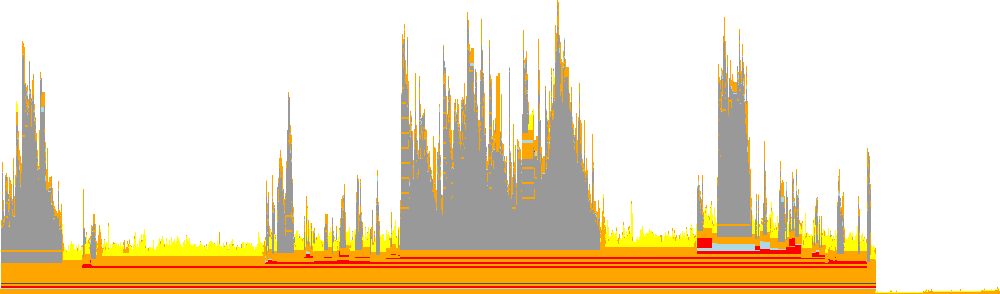
FlameGraphs.jl provides the basic functionality to convert the data given by Julia’s Profile.jl into something that we can plot. We then need to add ProfileView.jl to be able to generate interactive plots.
Basic Commands
If you decide to only include the Profile.jl package then you would run the following code to profile the function myfunc:
myfunc(); # run once to force compilation and avoid profiling Julia's compiler'

using Profile
@profile myfunc()

Profile.print()
The Profiler.jl documentation explains how to interpret the output. Every time you profile a piece of code with @profile the output is added to a buffer that is printed with Profile.print(). If you want to start fresh you can run Profile.clear(). More in-depth information about profiling your code with only Profile.jl is available in the documentation.
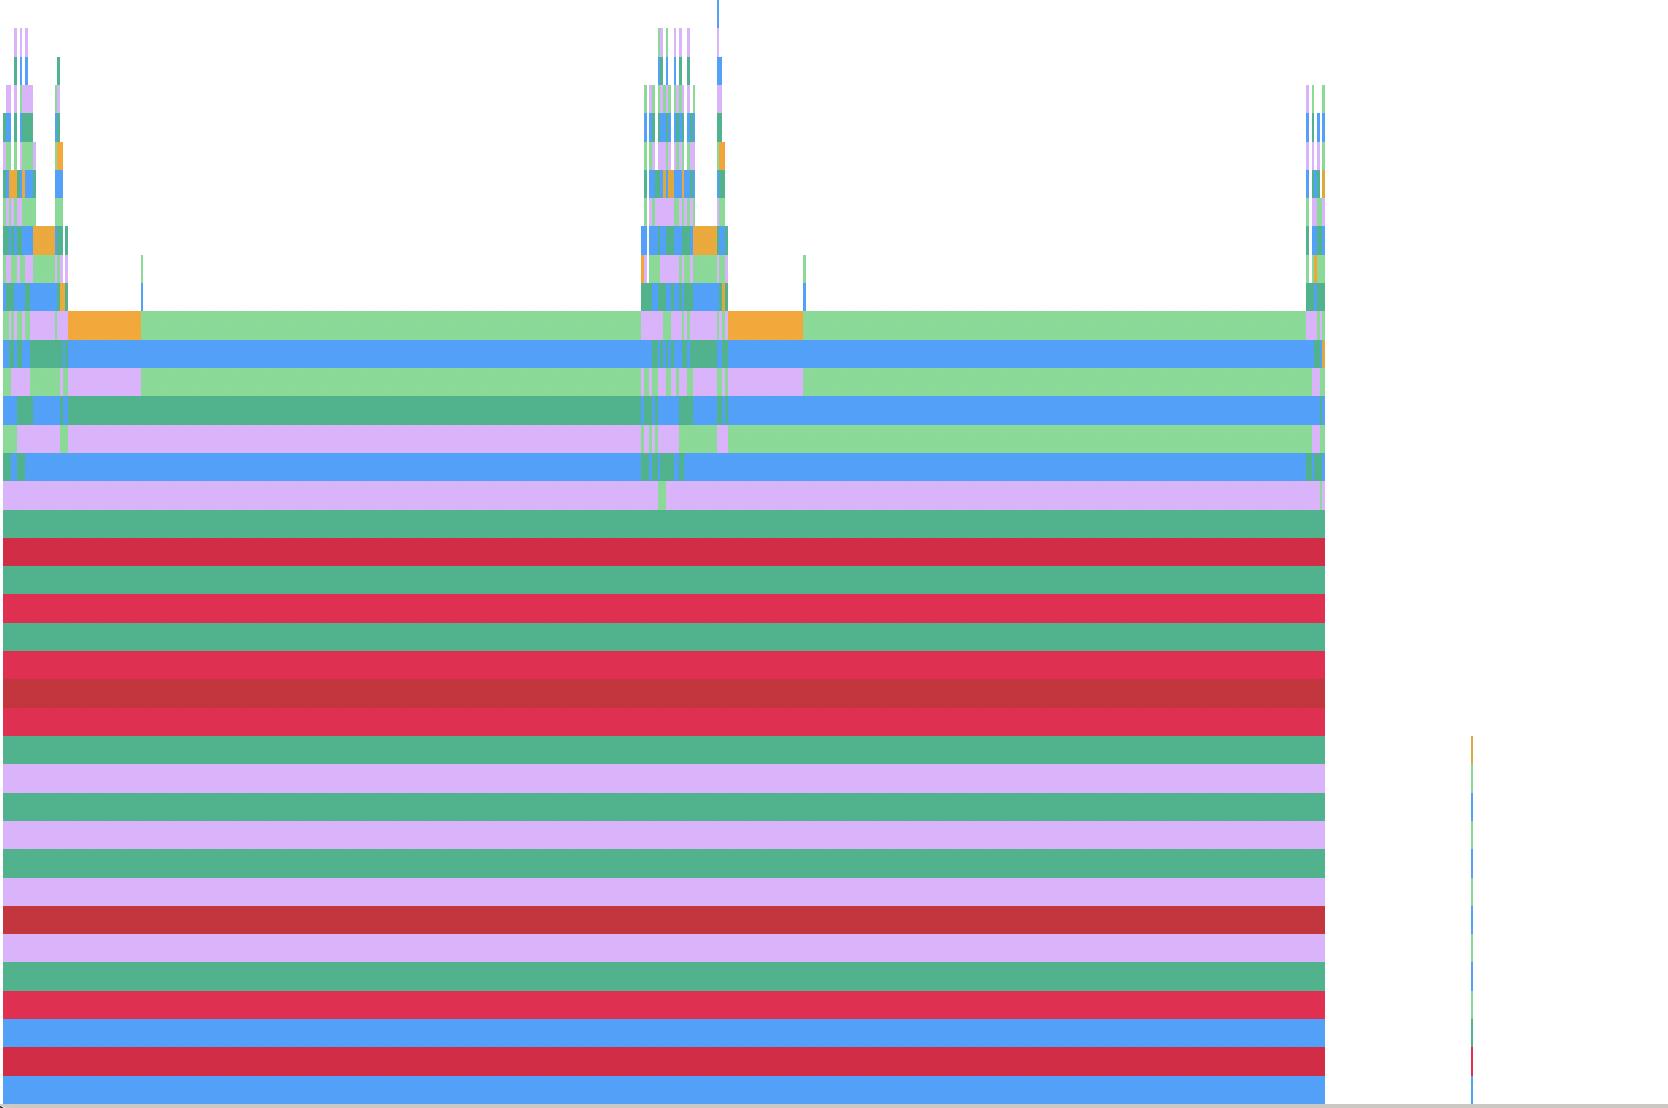
If you decide to generate flamegraphs, you will use both FlameGraphs.jl and ProfileView.jl. Additionally, it seems that if you specifically want an SVG you should also include ProfileSVG.jl. The examples in the documentation use the command @profview f(args...) to profile the code, which is shorthand for Profile.clear(); @profile f(args...); ProfileView.view(). In VSCode you will get an error if you try to use this shorthand. VS Code has its own @profview defined, which creates a conflict. You can fix the conflict by specifying ProfileView.@profview. I tested this on my own code and the input and results are shown below.
using T4Chain # name of the module that I'm coding up
using Profile, FlameGraphs, ProfileView # packages for profiling

# running once to force compilation, saving results for plotting and analysis
Eavg, Econv, tempAvg = T4Chain.OneDThermal()

ProfileView.@profview T4Chain.OneDThermal()
Memory Allocation
Julia allows you to track line-by-line allocation. To do this, you need to start Julia with the --track-allocation=<setting> command-line option. The settings available are none, the default, doesn’t measure allocation, user, measure memory allocation everywhere except Julia’s core code, and all, which does include Julia’s core code. Typically, you are interested in analysing your own code and will use the user setting.
After starting Julia with this command-line option, you can run the code that you want analysed. Because compilation requires memory allocation, it is recommended that you force compilation by executing your code and any auxiliary statements it requires before then calling Profile.clear_malloc_data(). This command resets all allocation counters and allows a compilation free view of the memory allocation in your code. After again executing the commands you wish to analyse, quit Julia to trigger the generation of .mem. files. These files contain the line-by-line analysis of your code. For every line where memory was allocated, the total amount in bytes is recorded on the left. For example, a section of my analysed code reads
        - function velocityRescale(T::Float64, pSection, osc::Oscillators)
        -     # determine current kinetic energy of region being rescaled
        -     # choice of units results in KE being equal to the temperature
        -
        -     # handle a section that is broken into two pieces
  9600144     temp = []
        0     for k in pSection
1273614608         push!(temp, k .* k)
        -     end
        0     KE = sum(temp)
        -     temp = 0
        -     # if KE has a length greater than 1 (i.e. is not just a number) then we had two sections and need to sum again
        0     if length(KE) > 1
  1600032         KE = sum(KE)
        -     end
        -
        -     # determine scaling factor
        -     # osc.N is the total number of oscillators in the system
        -     # the number per region (hot,cold,system) is a third of the total
  9600144     λ = sqrt((osc.N / 3) * T / KE)
        -
        -     # re-scale the momentum
        0     return λ .* pSection
        - end